IAESAT: the economy measured from space
Can subnational economic activity be measured where timely or reliable statistics do not exist?
The context
Across much of Latin America, official statistics arrive late — or never at all. Quarterly national accounts are published with months of lag, subnational detail is scarce, and in the extreme case of Venezuela official GDP stopped being published regularly years ago. For anyone who needs to read the economic cycle in near real time, that gap is an operational problem, not an academic one.
Satellites offer a way out. Since Henderson, Storeygard and Weil (2012), applied economics has known that nighttime luminosity correlates with activity: where there is production there is light, and light can be measured every night, for any territory, without relying on any statistical office.
IAESAT turns that idea into a complete measurement system, with three deliverables: (i) a monthly activity index for each of 8 economies in the region, plus Venezuela; (ii) a regional aggregate weighted by GDP, comparable with conventional monthly indicators; and (iii) the same index with subnational detail for ~150 administrative regions — departments, provinces and states — built within the same pipeline.
How it is built
The input is VIIRS nighttime-lights imagery processed in Google Earth Engine. Every step of the pipeline solves a real problem in the raw data: tropical cloudiness is handled with country-specific coverage thresholds (a percentile of clear nights, because an absolute threshold would unfairly penalize equatorial countries); moonlight and extreme values are filtered; gas flaring from oil fields is masked so that a flare in Zulia is not read as an industrial boom. The series are decomposed with STL in logarithms and indexed to a base of 2019 = 100, the standard for the region's monthly activity indicators.
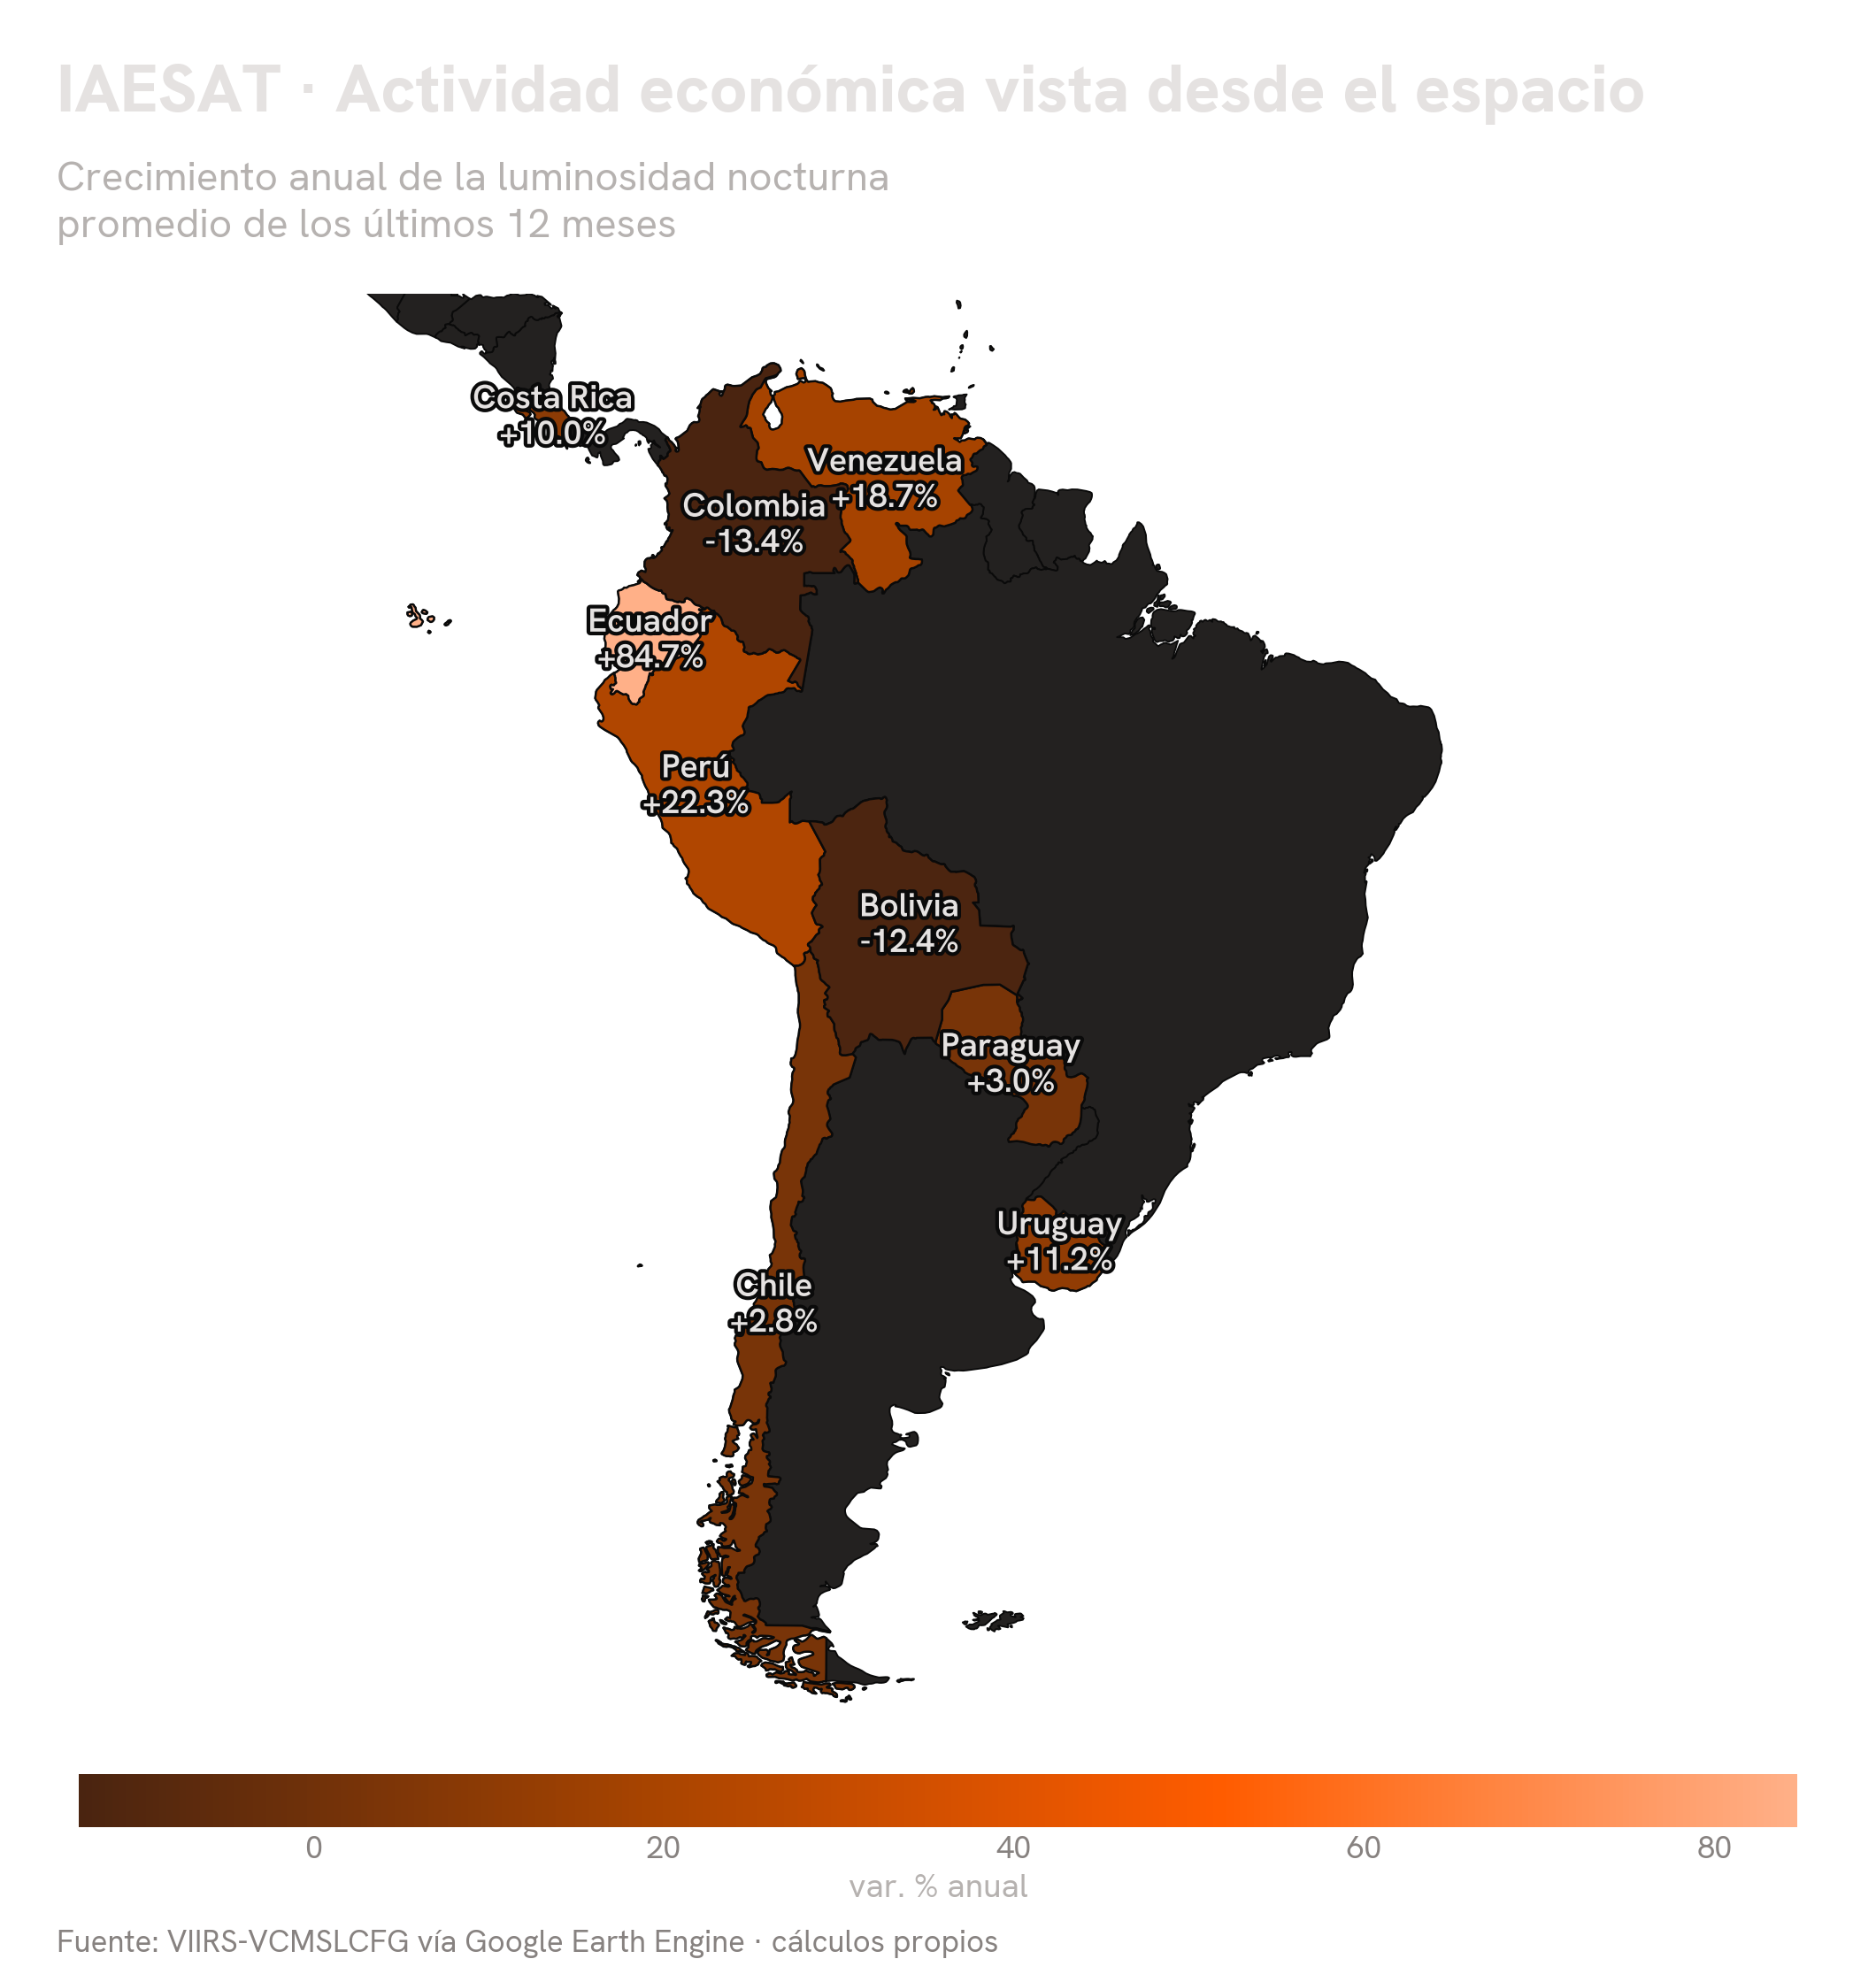
Aggregation runs at two levels: each administrative region (departments, provinces, states) gets its own series, and the national index weights those regions. The regional aggregate weights countries by their GDP — the same criterion used by conventional regional indices. The map accompanying this section summarizes the result at the country level: the annual growth of luminosity over the last year, country by country.
What the data show
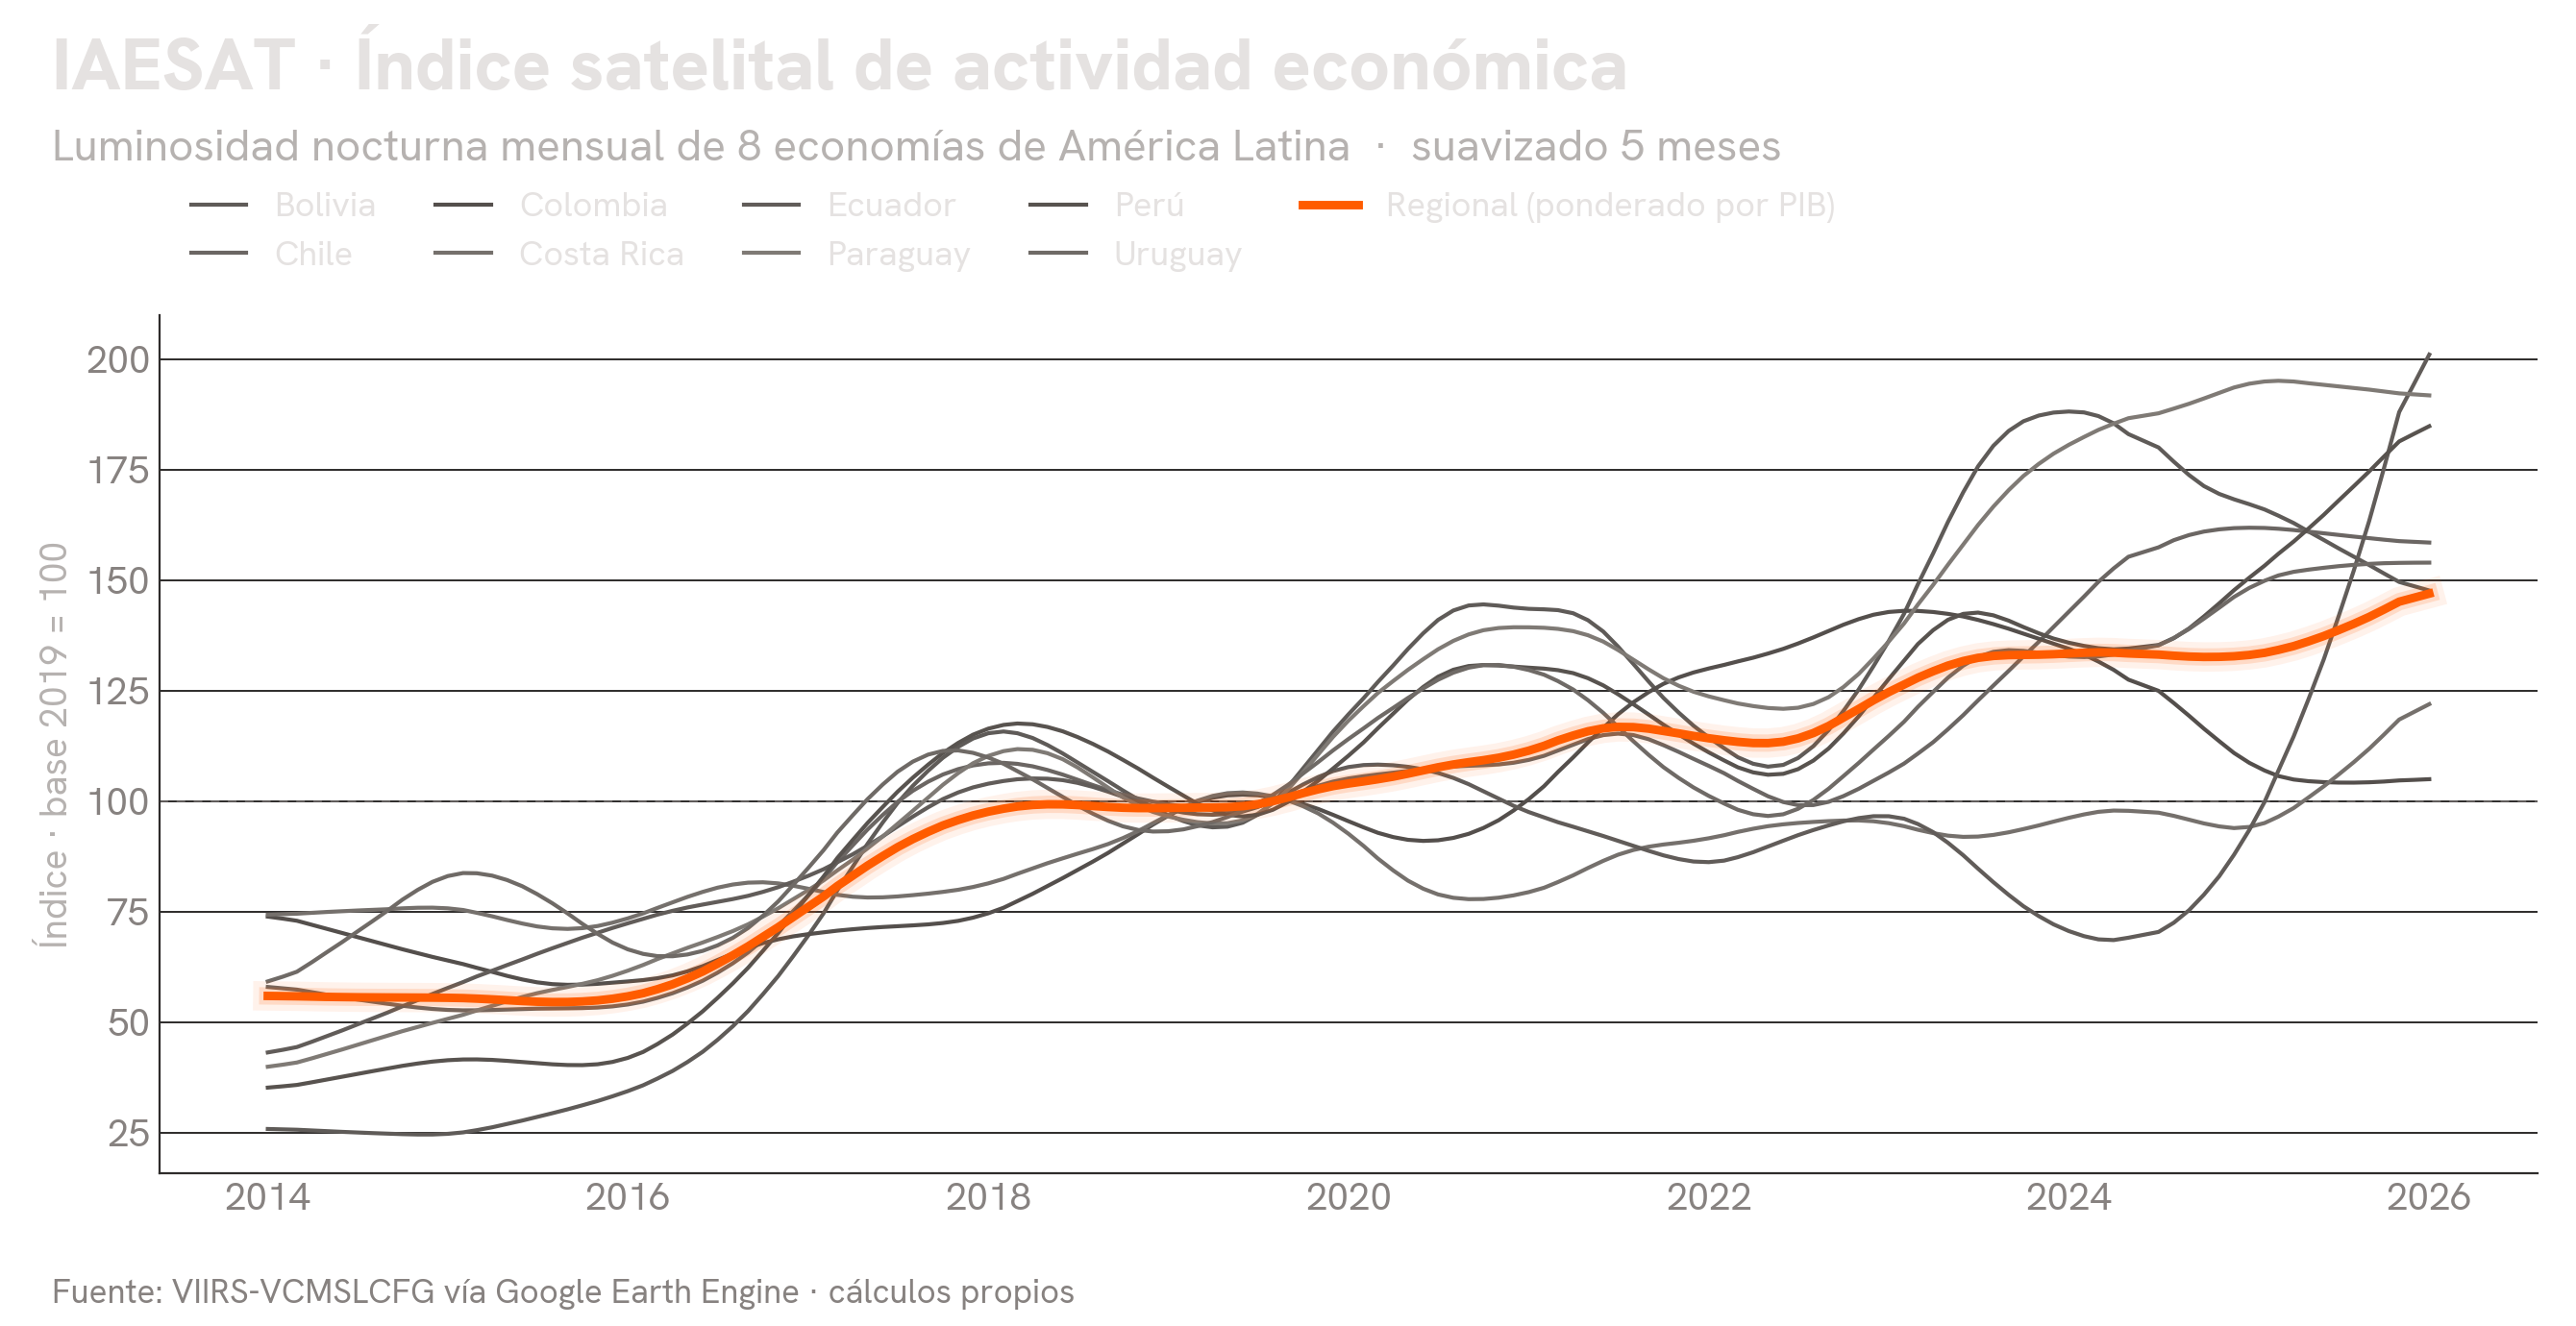
The series accompanying this section shows each country's index alongside the regional aggregate in orange: the common cycle is visible, and so is the dispersion across countries. Validation against official GDP shows that the index's performance depends on the structure of each economy: in urban, service-based economies it tracks the cycle with clear positive correlations, whereas in commodity-exporting economies — where value added is generated in mines, wells and fields that use little light — the national signal is weaker, because luminosity measures where people live and consume, not where the mineral is extracted. On top of this there is a technical challenge documented in the literature: the calibration of the standard satellite product has a known drift after 2018 that is controlled in processing and bounds the reading of long-run trends.
Venezuela: measuring a statistical black hole
The project's most ambitious module brings Venezuela inside the same pipeline as the rest of the region. It is the definitive use case for the satellite approach: an economy whose collapse and partial recovery took place, in large part, without official statistics to record them. The lights make it possible to reconstruct a comparable activity series — with the caution demanded by the weight of oil in the signal — and to estimate which regions fell most and which are recovering.
The subnational detail
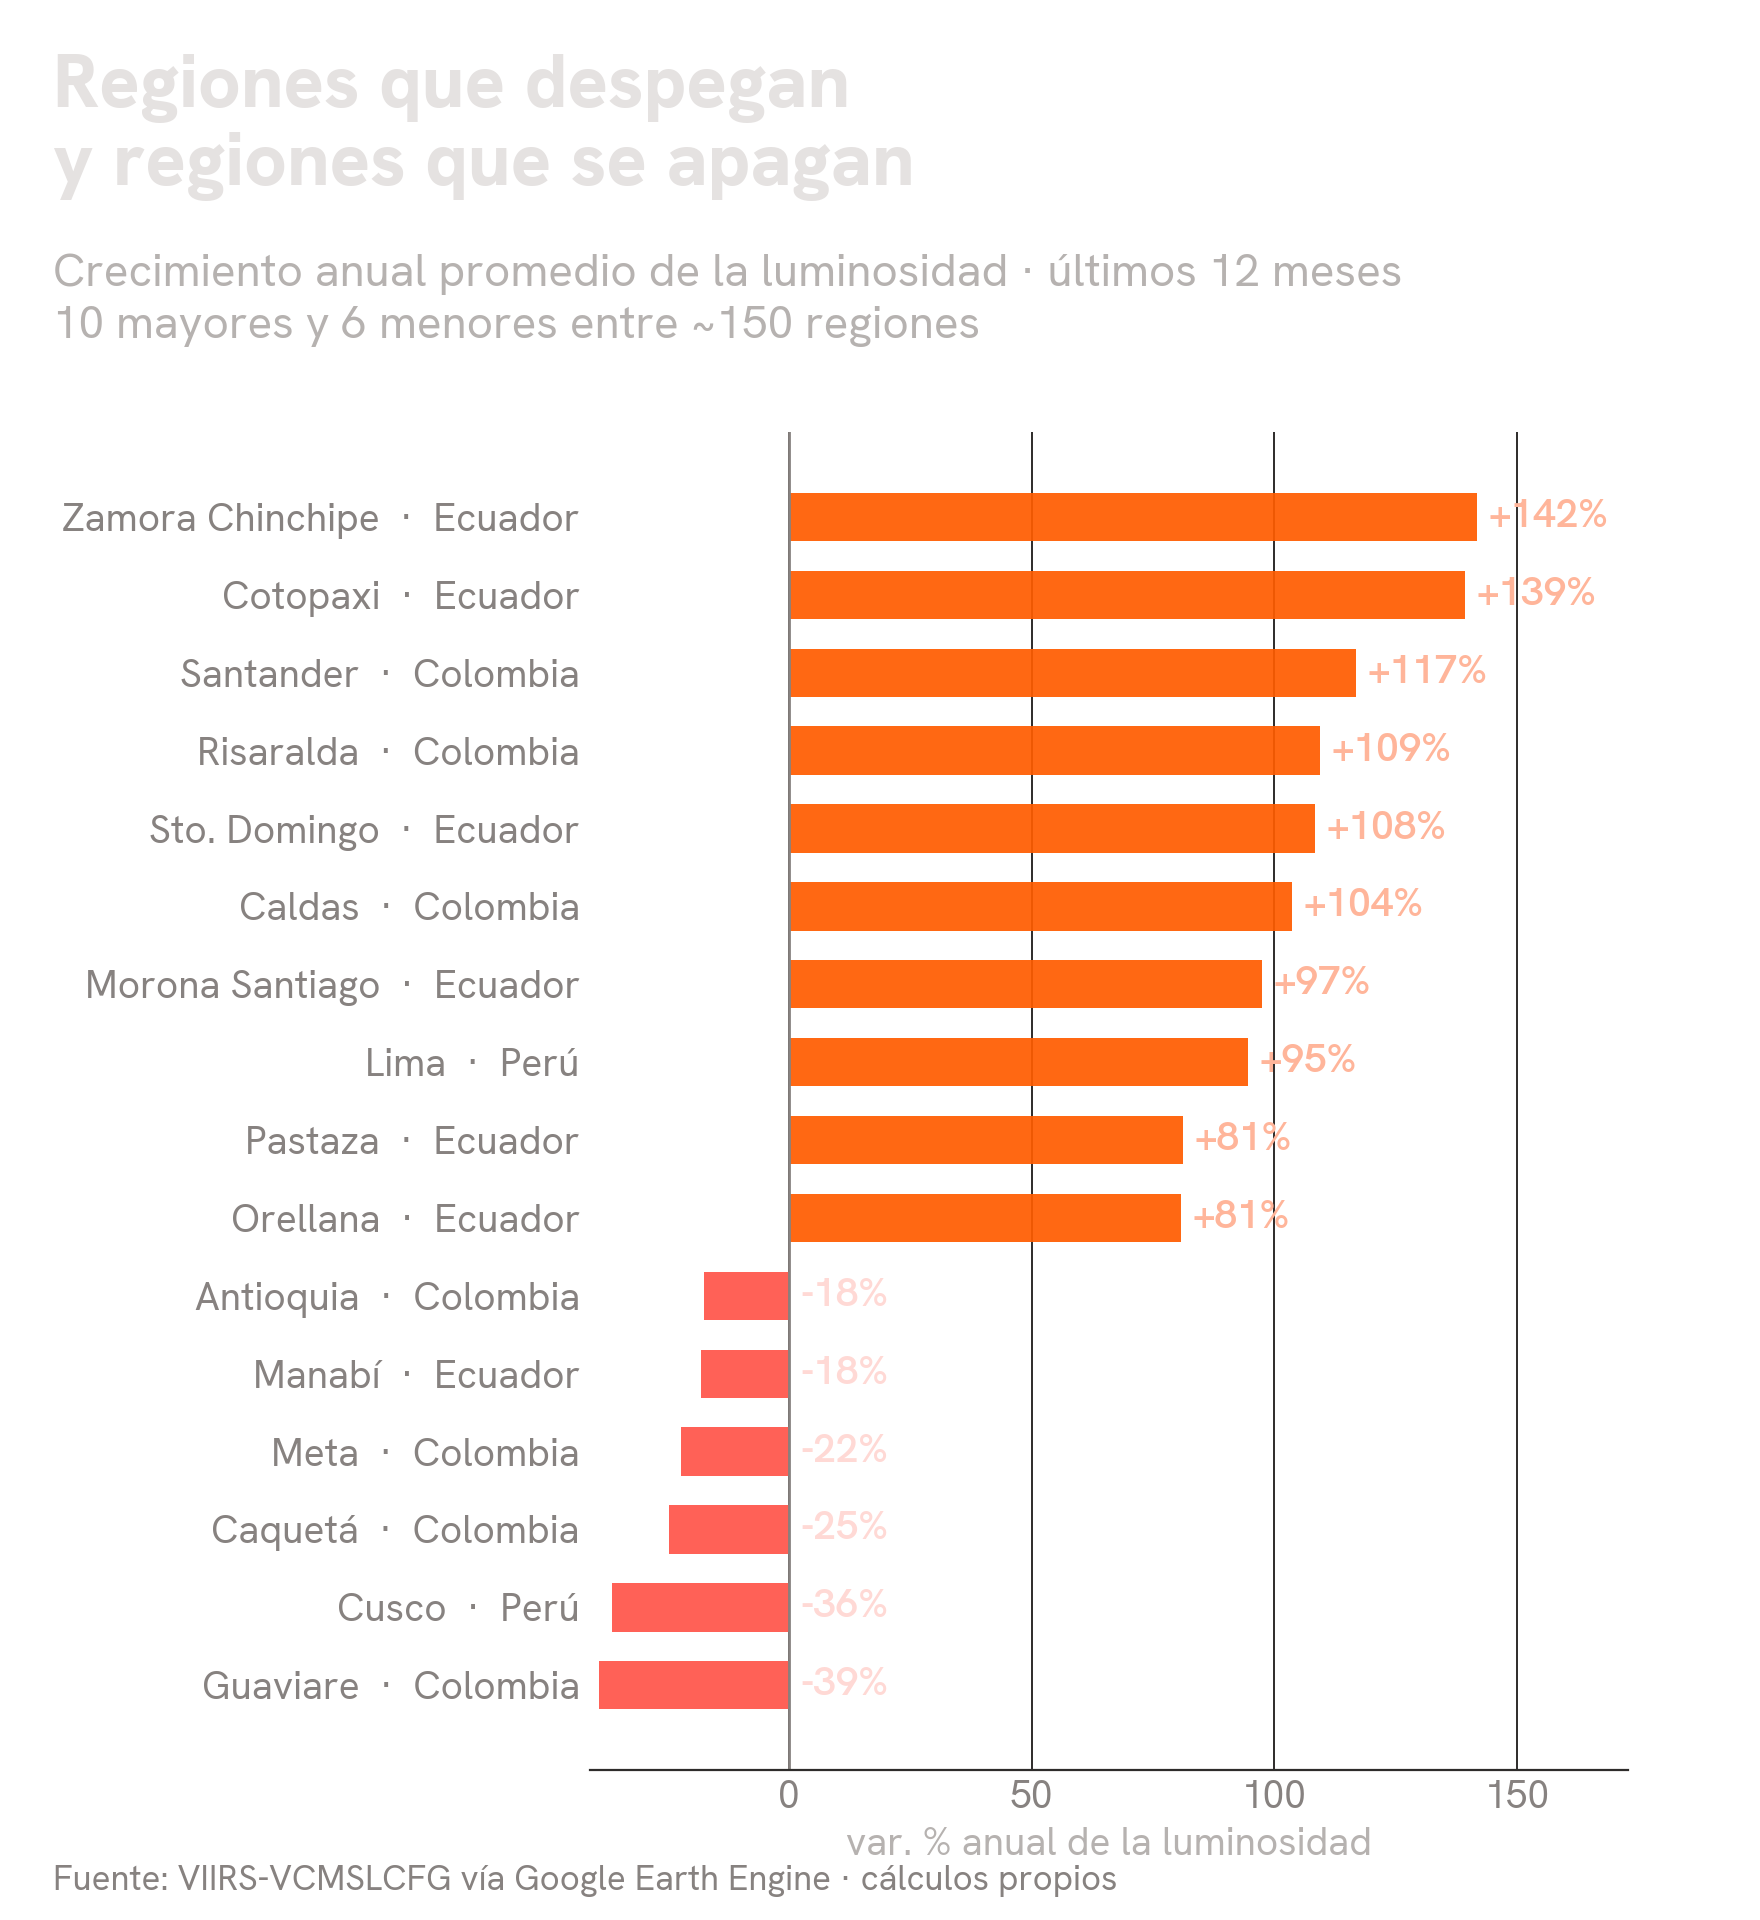
The same signal that produces the national index is aggregated by administrative region, and there what the national average hides comes to light. The ranking accompanying this section illustrates it with the last year of data: at one extreme, regions whose luminosity grows at three-digit rates; at the other, regions that are going dark — sometimes within the same country. That contrast is the kind of heterogeneity that no aggregate figure captures, and the whole point of the subnational module.
Future work
- Explore other satellite tools, such as NASA Black Marble — the new generation of nighttime lights, with more stable calibration —, and validate the index month by month against each country's official activity indicators.
- Exploit the subnational panel: regional convergence, the anatomy of the COVID-19 shock region by region, and the contrast between urban and commodity economies within a single econometric framework.
Tools
Python and Google Earth Engine (geospatial processing at scale, with partitioning strategies for large countries), pandas for the panels, matplotlib and geopandas for the figures.
Scope: nighttime lights better capture urban and energy-intensive activity; national results depend on the economic structure of each country and on the quality of the official GDP used as a benchmark. Sources: VIIRS nighttime lights via Google Earth Engine · official GDP and monthly indicators for each country.
Interested in this topic?
Let us talk about satellite data, nowcasting or collaborations.