Growth at Risk: measuring what climate could cost growth
The average forecast is the comfortable part of macroeconomics. The uncomfortable question — and the one that matters for risk management — is a different one: if things go wrong, how wrong can they go? Growth at Risk exists to answer exactly that, and climate is becoming one of its most relevant inputs.
The idea in two minutes
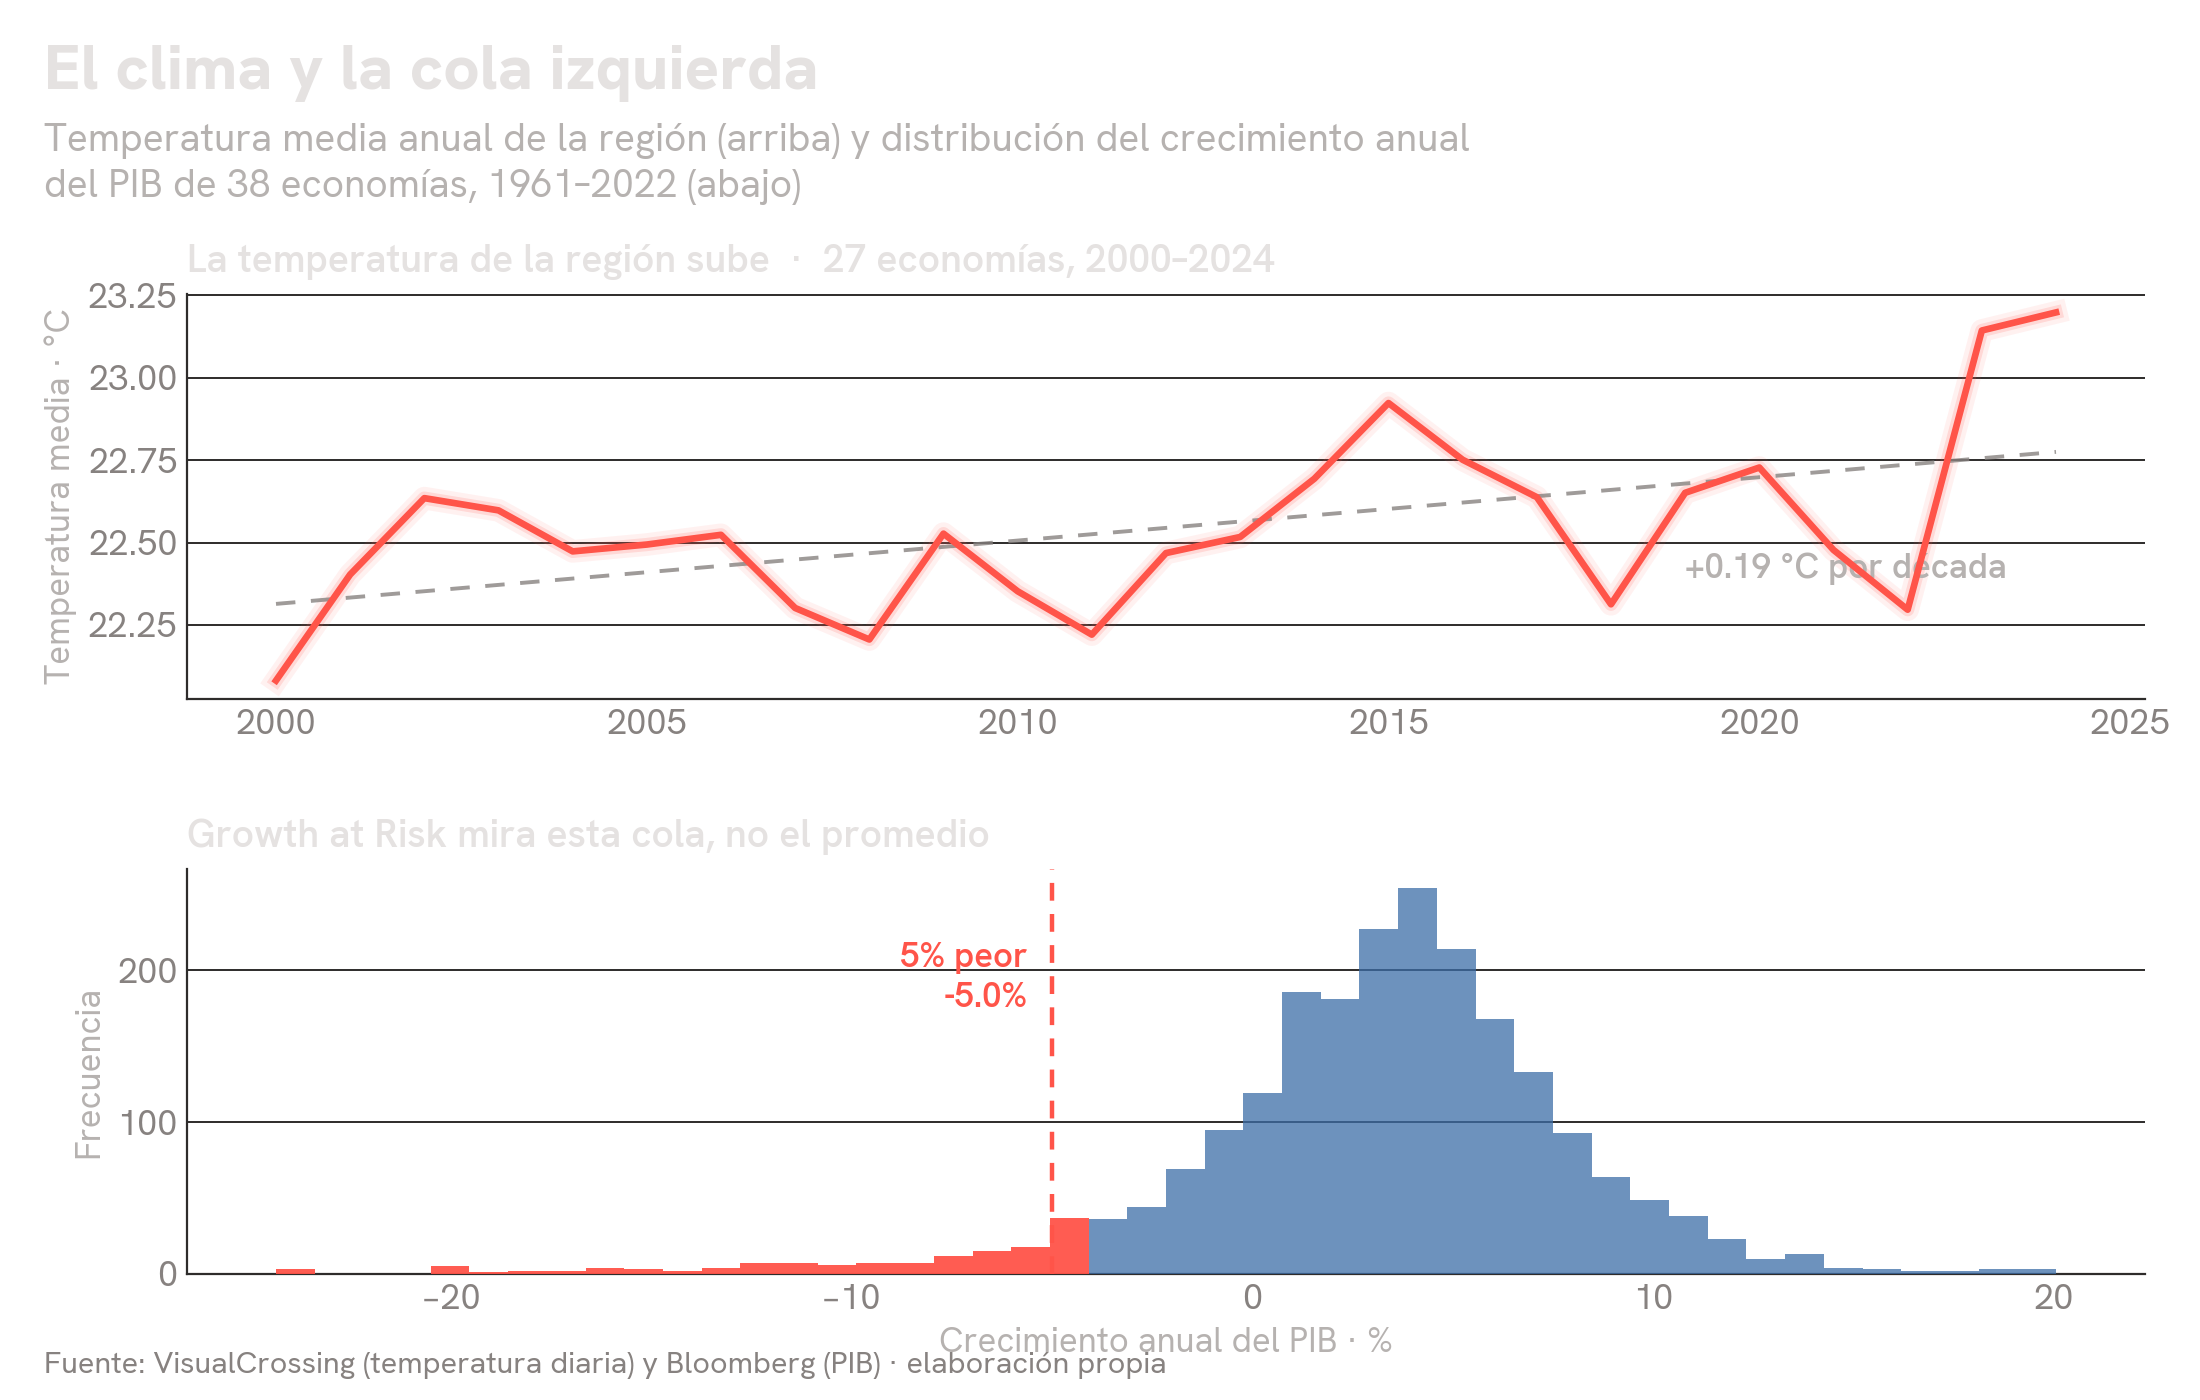
Growth at Risk (GaR) carries over to macroeconomics an old idea from finance: value at risk. Instead of asking how much an economy will grow on average, it asks about the low percentile of the distribution — for example, the growth rate that is only missed in the worst 5% of scenarios. Technically it is estimated with quantile regression: while classical regression fits the conditional mean of future growth, quantile regression fits any point on the distribution, including the left tail that keeps you up at night.
The result is a full distribution of future growth conditioned on the present: financial conditions, commodity prices, activity — and, increasingly and rightly so, climate variables.
Why put climate in the tail
For Latin America and the Caribbean, climate is not a long-term issue: it is short-term volatility. Droughts that hit hydroelectric generation and agriculture, extreme rainfall that destroys infrastructure, hurricanes that can cost a small island several points of GDP in a single week. Climate vulnerability indices (ND-GAIN, INFORM, WorldRiskIndex) tell a consistent story: several of the most exposed economies in the hemisphere are also the ones with the least fiscal room to absorb the blow.
The average hides the problem: two economies with the same expected growth can have completely different risk tails. GaR makes that difference visible.
In the exercise I developed in 2025, I combined quarterly GDP from economies across the region — including several in the Caribbean and Central America where the data is hard to obtain and has to be rebuilt from national sources — with climate data on precipitation and temperature (stations and satellite). The question: how far does the left tail of growth shift when the climate shock is severe?
What this approach changes in practice
- Macro-financial surveillance: it lets you talk about adverse scenarios with probabilities, not adjectives. "The worst 5% implies a contraction of X%" is an actionable sentence.
- Buffer design: reserves, liquidity lines and fiscal space are sized against the tail, not against the average.
- Differentiation across countries: climate exposure reorders the region's risk map — small and island economies climb positions that average GDP does not show.
The pitfalls of the method
GaR is not a crystal ball. Three warnings from someone who has estimated it: the tails are estimated with few extreme observations, so the intervals are wide and you have to say so; the choice of conditioning variables matters as much as the method — a GaR with poor variables is a regression dressed up as sophistication; and climate data requires the same quality control as economic data, because a downed weather station can manufacture a "drought" in the series. This last point is not theoretical: while preparing the figure for this note I discarded a widely used temperature series because it had a jump of more than a degree in a single year, simultaneous across half a dozen countries — a change of measurement disguised as a climate phenomenon.
Even with those caveats, it is one of the tools with the best effort-to-insight ratio in applied macro: it turns the risk conversation — usually qualitative — into a distribution that can be charted, compared and monitored.
Note based on my own 2025 exercise using quarterly GDP for Latin America and the Caribbean, precipitation and temperature data (NOAA, NASA IMERG, VisualCrossing) and climate vulnerability indices (ND-GAIN, INFORM, WorldRiskIndex).